


.svg)
New figures from the Department for Work and Pensions (DWP) show that 300,300 children aged 0 to 15 were living in poverty across London as of March 2024. That’s an increase from 282,661 the previous year, meaning about 18% of children—or nearly two out of every eleven—are affected. But some neighborhoods are seeing far worse conditions.
In Camden’s Bloomsbury ward, a staggering 45% of children live below the poverty line—the highest percentage in London. However, it still doesn't rank in the top 200 nationally. Other severely affected areas include St Pancras & Somers Town (Camden) and Stepney Green (Tower Hamlets), where 38% of children live in poverty.
Additional hotspots include Weavers and St Peter’s in Tower Hamlets (37%), Holborn & Covent Garden (Camden) and Maryland (Newham) at 36%, and Woolwich Dockyard (Greenwich) and Little Ilford (Newham) at 35%.
At the other end of the scale, child poverty was only 2% in the wards of Campden (Kensington & Chelsea), Northcote (Wandsworth), and East Sheen (Richmond upon Thames)—the lowest rates in the capital.
You can explore how your neighborhood compares using our interactive poverty map, which also allows you to contact your local MP.
Nationally, a record 4.5 million children in the UK were living in poverty by March 2024—an increase of 121,000 from the previous year. Some areas, especially in the North of England, show even more alarming statistics. In Middlesbrough’s Newport ward, 85% of children are living in poverty, the highest rate in the UK.
Other areas with extremely high child poverty rates include Manningham in Bradford (72%), Bordesley Green and Heartlands in Birmingham (71% and 70%), Daneshouse with Stoneyholme in Burnley (69%), Bradford Moor (69%), and Gipton & Harehills in Leeds (69%).
The 20 most affected areas are all located in the North of England or Birmingham, showing a sharp regional divide.
In the South and East, Peterborough’s North ward had the highest rate, with 60% of children living in poverty. In contrast, Oxford’s Walton Manor ward had the lowest rate in the UK, with less than 1% of children affected. The same was true in Godalming Holloway (Waverley) and Oatlands and Burwood Park (Elmbridge), each with only 1% of children in poverty.
It’s important to note that local figures differ slightly from national ones. While national statistics factor in housing costs and include children up to 19 years old, local numbers only include children aged 0 to 15 and do not adjust for housing costs. Therefore, actual child poverty rates may be higher than reported locally.
A Government spokesperson responded:
“No child should live in poverty. That’s why we’re developing a comprehensive strategy to support children as part of our Plan for Change. We’ve raised the Living Wage, increased benefits, and introduced fairer repayment terms for Universal Credit to ease financial pressure on low-income families.”
Two-Child Benefit Cap Under Scrutiny
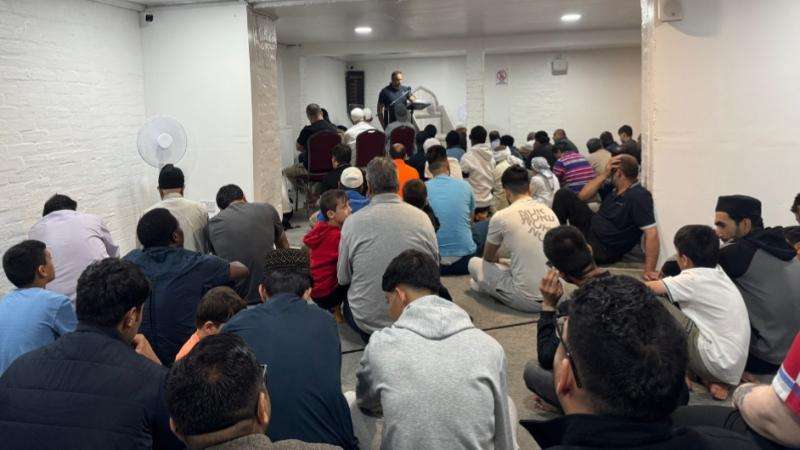
April marked the eighth anniversary of the two-child benefit cap. Data from the End Child Poverty Coalition suggests a strong link between this policy and rising child poverty. About one in nine children are affected by the cap nationwide. In some areas, the impact is even greater—affecting one in four children in Leeds South and one in three in Hackney North and Stoke Newington.
Joseph Howes, Chair of the End Child Poverty Coalition, emphasized:
“Abolishing the two-child limit is essential if the government wants to tackle child poverty seriously. Removing it could also benefit struggling local economies. Families can’t endure another year under this policy—it must be scrapped.”


.jpeg)
